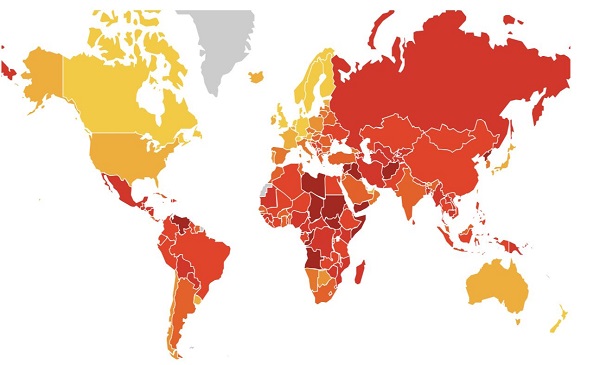
 Snapshot Courtesy: Transparency International
 India has seen an improved performance in the annual Corruption Perception Index (CPI), 2018. The country scored a 41 out of a possible 100, up 1 point since 2017 and maintained the trend of an improved score on the CPI since 2012, and ranks 78th globally this year - up 3 places since 2017.
The annual 2018 was released on the 29th of January 2019 ,which is considered to be one of the most widely used reports on insights in corruption in countries' public sphere.
India is still below the global average score of 43, and this year's report has witnessed almost two-thirds of 180 countries having a score of less than 50.
BOOM looks at these reports and tells you 5 things you need to know
1. What is this report about?
The CPI is released by an organisation called 'Transparency International', which ranks 180 countries on the basis of
how corrupt the public sector in various countries is viewed by experts and business executives, with numbers being released since 1995.
All countries are assigned score between 0-100, and are then ranked on the basis of their score. A higher score is indicative of corruption being perceived to be less rampant, and is thus better, implying that 0 is the worst score a country could get and 100 the best. On the contrary, a lower rank is better, and rank #1 is the best attainable rank by a country.
The report specifically mentions 'perception' since corruption as a notion is intangible and cannot be measured quantifiably yet, and corruption only comes out through scandals, scams, investigations and persecution.
Transparency International has released a video regarding their new index here:
This report captures facets such as but not limited to:
- Bribery
- Division of public funds
- Protection offered to whistleblowers, journalists and investigators
- The ability of a government to curtail/prevent corruption.
- Prosecution of corrupt officials
- Access to information for civil society on the public services/officials
However, this report does not capture nuances such as:
- Corruption in private sector
- Money laundering
- Tax fraud
- Citizens' perception of corruption
This is the embeddable interactive graphic as provided by Transparency International.
2. How are these scores calculated?
The CPI is a composite index - it is sourced from 13 different data sources and aggregated to give them one consolidated score. These data sources are from reputed organisations such as:
- The Economist Intelligence Unit Country Risk Service 2018
- World Bank Country Policy and Institutional Assessment 2017
- World Economic Forum Executive Opinion Survey 2018.
The entire list of the data sources and an exhaustive survey methodology can be found here. These data sources give rise to insights in the qualitative data such as opinions and perceptions based on carefully crafted questionnaires and quantitative data.
Once these data sources are obtained, they are rescaled to obtain a score between 0-100 (where 0 is the worst score a country could get and 100 the best), following which CPI is calculated by averaging the aggregated rescaled scores of all data sources for that country.
Finally, since this metric is calculated from various different data sources, Transparency International also calculates a measure of uncertainty termed as 'standard error' in the data provided, reported next to the score for each country. A higher standard error for a country describes a higher discrepancy amongst data sources for a particular country. The entire calculation methodology is available in this link.
3. What are the highlights of this year's report?
Denmark and New Zealand are in the top 2 positions in this year's CPI.
South Sudan, Syria and Somalia appear at the bottom of this year's CPI with the lowest attained scores.
Amongst other highlights:
- The United States of America dropped out of the top 20 for the first time since 2011.
- Brazil has earned its lowest ever score of 35.
- Transparency International calls Australia, Malta, Chile, Turkey and Mexico to be the biggest losers and Estonia, Cote D'Ivoire, Guyana and Senegal to be the biggest gainers in 2018. These categorisations are not done on basis of the magnitude of change in score or ranking, but rather on how "statistically significant" these changes are.
4. Highlights of India's score in the 2018 CPI
India's score on this CPI is 41 out of a possible 100, the highest score it has ever received, with a global rank of 78. However, it is to be noted that while this score is the highest received by India, Transparency International advices against comparing scores before and after 2012 due to a change in calculation methodology.
At rank 78 and with a score of 41, India is tied with the following countries in this years CPI:
This is how India stacks up against her immediate neighbours in the Indian subcontinent.
This is India's stand amongst its global peers in BRICS
The following is India's standing amongst its international peers in the G20:
5. India's Score and Rank Over The Years
In terms of the absolute score, India's has witnessed a year-on-year improvement, although its rank fluctuates over the years; the rank being relative to the performance of other countries as well.
Note: A higher yearly score is better, whereas a lower yearly rank is better.
The report in its entirety can be found here.